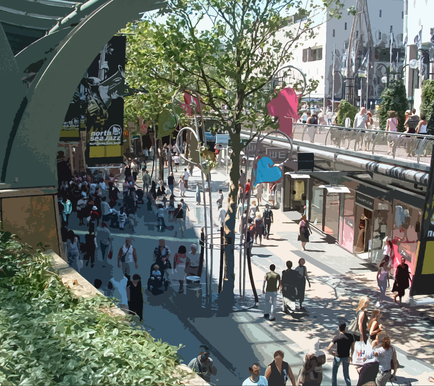
 Rotterdam, photo taken by author in 2006, edited in Photoshop Cities are places where everything and everyone come together. They join together all walks of life in close proximity. Cities are the hope of the people who come join them. They represent opportunity in the economic sphere in terms of jobs, professional connections, and exchanging ideas. Cities also represent social opportunity related to friends, meeting a potential mate, and having roots that truly ground you to a place. In short, people come to cities for their lives to flourish.
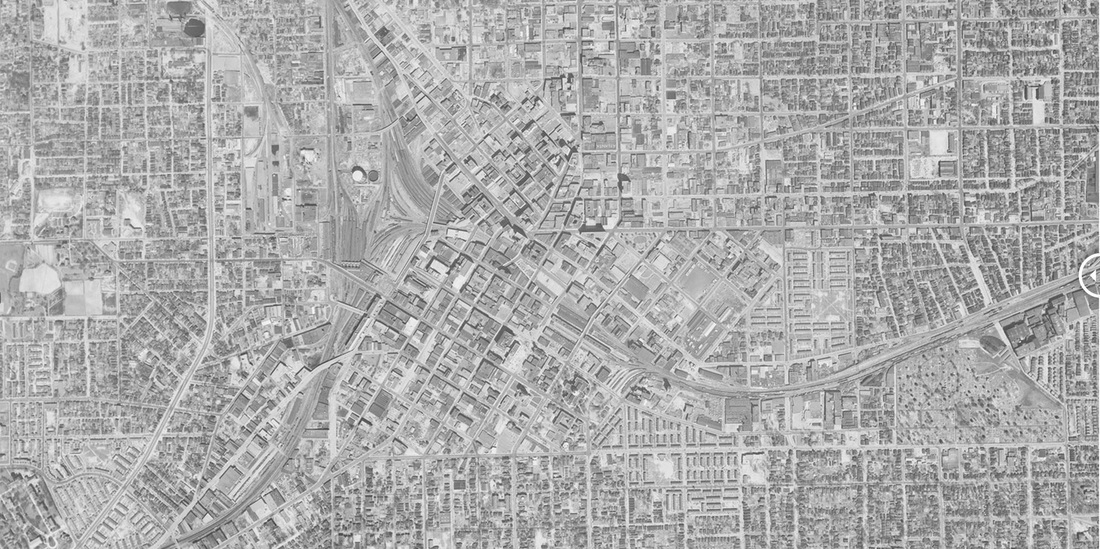
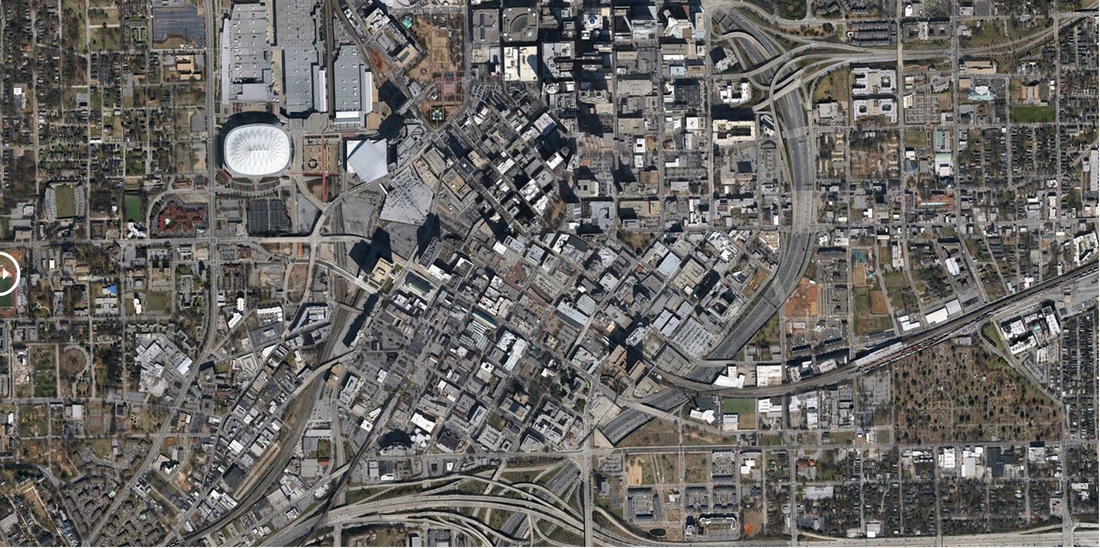
Integrating interdisciplinary and transdisciplinary understanding For people leading the planning, design, and construction of cities on behalf of the people who live in them, it is becoming more frequent that interdisciplinary and even transdisciplinary understanding is taken into consideration. Since cities function as interconnected systems, even a system of systems, those who lead urban development are working to understand its complexities. There are three primary ways that groups who lead urban development intentionally integrate this notion – through 1) individuals, 2) teams, and 3) processes. First, as individuals, professionals are becoming more "T-shaped." While they might have a very deep understanding of one specific area, they will also understand a number of other subjects/disciplines well enough to make connections between all of them. Second, on teams, there is an intentional practice of hiring people who fill skill gaps. Examples include bringing a biologist to work on an urban design team, a software developer to better understand planning functions, or a public health professional to clarify health impacts. Third, progress has been made at integrating the sustainable development “three pillars” concept of economic, environmental, and social into specific processes. Two key examples in the United States are environmental impact assessments and health impact assessments. The former is led by the United States Environmental Protection Agency (US EPA) under the National Environmental Policy Act (NEPA). The Pew Charitable Trusts describes the latter as “… a fast-growing field that helps policy makers take advantage of these opportunities by bringing together scientific data, health expertise and public input to identify the potential—and often overlooked—health effects of proposed new laws, regulations, projects and programs.” Three pillars of sustainable development The ideas behind the three pillars of sustainable development, economic, environmental, and social, were developing as early as 1987 with the publication of “Our Common Future” by the World Commission on Environment and Development (chaired by the Prime Minister of Norway at the time, Gro Harlem Brundtland). Agreeing on a common definition was, and still is, critical in order for a broad group of international partners to collectively focus their direction. As Bruntland stated, “The ‘environment’ does not exist as a sphere separate from human actions, ambitions, and needs, and attempts to defend it in isolation from human concerns have given the very word ‘environment’ a connotation of naivety in some political circles…the ‘environment’ is where we live; and ‘development’ is what we all do in attempting to improve our lot within that abode. The two are inseparable.” Many in practice, including the United States Environmental Protection Agency (US EPA), have adopted the three pillars concept. By linking economic, environmental, and social impacts together to understand “development,” even as overlapping as they are, an extremely broad group of specialists and advocates from a variety of nations and cultures were able to see themselves in the work of others for the benefit of society as a whole. Zooming into the program/project level in the built environment, some of the economic impacts have been easy to understand related to employment opportunity and connectivity, real estate values, return on investment (ROI), etc. Environmental impacts can be understood according to land degradation, water pollution, air pollution, etc. To some extent, for lack of better tools for systems analysis, these can be understood with methods that involve looking only at a few variables at a time. For some social issues, the analysis requires a systems thinking approach even for a basic understanding. In a previous blog post, I drafted one way of thinking about the system of repeated cycles of poverty. While we have made significant inroads over the years on understanding environmental and economic impacts, perhaps the reason why we have not made as much progress on social impacts is due to a lack of structured understanding and tools. Until a more level playing field is created for understanding the tradeoffs between economic, environmental, and social impact in the built environment, the analysis will continue to shift in favor of one or the other, even though professionals might acknowledge the importance of all three working in tandem. Democratization of data and data science Making decisions in the complex urban environment is an incredible responsibility. The quality of decision-making is a significant contributing factor to the level of opportunities within a city, and it does influence the lives of the estimated 3.5 billion people living in cities across the world. The democratization of data has made incredible progress in the past several years and continues to do so, but data is only valuable when people know what to do with it. We need what Stephen Wolfram calls a democratization of data science, and for those of us responsible for city decision-making, we need a democratization of urban data science. While it is true that we have incredibly helpful tools such as Geographic Information Systems (even open source versions) and physical city modeling software to guide decisions, these tools do not allow for a simplified analysis of systems and complex/multi-criteria decision-making nor are they accessible to less technical staff and decision makers. They will allow for a few variables to be analyzed at a time while others are generally understood in context, but they do not allow for a system (or system of systems) analysis that encompasses ten or more factors with intricate relationships between each other as explained in a previous blog post. While environmental impact assessments and health impact assessments are critical to moving the three pillars forward and integrating our work, they are time intensive and specialist driven. Due to this, they are not able to scale efficiently to reach professionals who work at every scale of urban development. If more tools and processes could be created to make this type of multifaceted analysis less of a commodity, then there would be more high quality decisions to improve the lives of the 3.5 billion people living in cities. We are now in a data rich world in terms of open data, big data, census data, and others, but how do we structure this data effectively toward the most important decisions we make? Systems leadership Even more than tools and processes, we need people, the kind of people who are “systems leaders.” These are the people who will lead the charge towards integrating data science between silos, disciplines, and subject matter areas for the benefit of those who are most affected by their outputs - the public at large. They understand that high degrees of collaboration are required to achieve results for the public, and they also know that there is a next step in the evolution of how decision-making occurs by working more intentionally as a system. These could be people at high levels of government who oversee various capital programs and budgets that straddle silos. Perhaps they want spending to become more efficient and tied to more focused results. They could be focused agencies/non-profits that tackle certain problems or work on behalf of one target population, but they also realize that their problem is connected to others. They could be real estate developers calibrating return on investment (ROI) with social and environmental concerns important to them as well as the city approving permitting. They could also be private planning firms that assist all these groups with their decision-making. Each group needs tools/processes to better understand how their own work areas and the work areas of related agencies, companies, and non-profits fit together as larger systems. While each city has its nuances and local challenges, the framework of economic, environmental, and social applies to all. There are certain qualities of cities that make them effective, because there are certain qualities of life that make living better for people. In the end, we may be more similar than we realize. People are complex beings. They have different needs and wants and have different situations into which they are born. Around the world, more than 50 percent of people now live in cities. In these urban environments, fully grasping needs and wants is extremely complicated in terms of understanding the tradeoffs between issues such as economic opportunity, transportation access, public health, and many more issues. In order to meet these needs and wants, even in part, a great deal of services are provided and infrastructure is built. The private, public, and nonprofit/philanthropic sectors all provide aspects of the services and infrastructure that is needed. 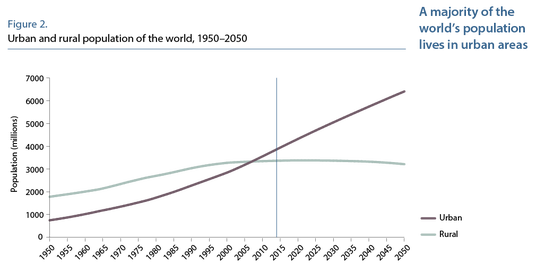 Source: United Nations In most nations, the primary responsibility for working on societal level problems is held with the government. Particularly in democratic governments, there is a notion of transparency regarding the tax paying public having access to information about how their tax funds are being spent on various initiatives, in support of specific goals, and making various levels of progress over the years. The needs and wants of people in the urban environment are complex and nuanced, bridging many subject matter areas, while government agencies tend to be structured by separate subject matter areas and tasked with completing specific programs within these areas. Professional success and incentives are often tied to staff members' performance in pursuit of subject matter specific initiatives. People often refer to this is a "siloed" system and even go one step further using a phrase, "breaking down silos," which is generally understood to be cooperating together on joint goals (if not actually restructuring in a less siloed way). In reality, the needs of people are not necessarily subject specific, although they sometimes appear to be. The past Let's go back in time to the 1950's. During this and the following decades, the United States (US) was investing heavily in building the interstate network to connect cities and towns to each other and optimizing local roads within cities and towns for automobile traffic. While the focus during earlier periods was on pedestrian and transit connectivity, the nation experienced a fundamental shift over many decades in transportation strategy and public investment toward auto-centric infrastructure. Many activists were forced to go to great lengths to protect neighborhoods within American cities from interstates (which are primarily intended for connectivity between cities/metro areas, not connectivity within cities/metro areas) slated to divide historic communities in the name of expedient travel. One well-known example is Jane Jacobs' battle with Robert Moses in New York City over this very issue during the 1960's. Jacobs and other supporters were successful in the end, but other American cities such as Atlanta (images below from the Institute for Quality Communities) have long suffered the consequences of interstates that dissected long-standing communities. Across the US, this advocacy for keeping neighborhoods intact at this time was referred to as the "Highway Revolts."
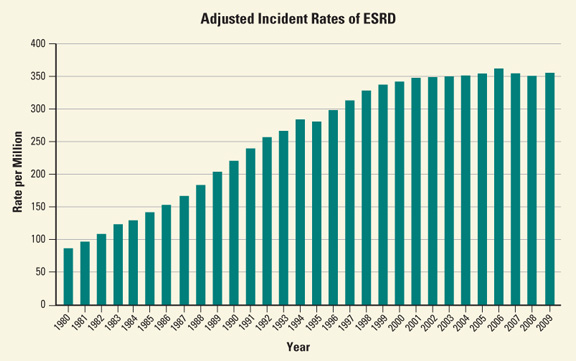
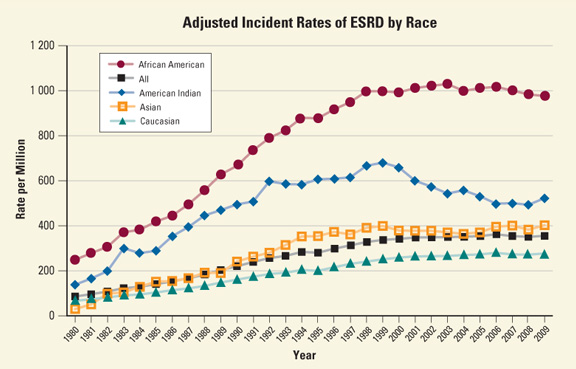
The focus on optimizing the nation for the automobile had not only community-level consequences, but also very serious public health consequences that plague American society to this day. Obesity and obesity-related chronic illnesses have grown steadily over the decades. The obesity epidemic is due in part to the reduction of active transportation/transit options and an overall auto-centric environment that requires very little walking (medical prescriptions, banks, fast food, etc. are even available directly from the car, to the occasional shock of non-Americans). The US Centers for Disease Control and Prevention (CDC) states, “Obesity is a national epidemic and a major contributor to some of the leading causes of death in the U.S., including heart disease, stroke, diabetes and some types of cancer. We need to change our communities into places that strongly support healthy eating and active living.” Although there are additional factors that have led to the obesity epidemic, our built environment is undoubtedly a significant contributor. 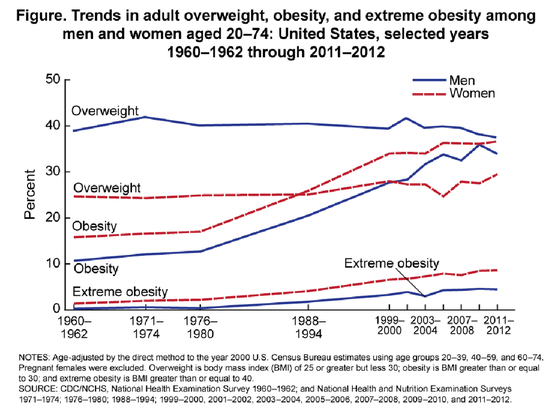 Source: Centers for Disease Control and Prevention The present These chronic illnesses often require continual treatment, as is the case with both Type 2 diabetes and kidney disease/end stage renal disease (ESRD). The CDC states, “The rise in the incidence of Type 2 diabetes cases is associated with increases in obesity, decreases in leisure-time physical activity, and the aging of the U.S. population." The chart below shows that the number of cases of diabetes in the US increased an estimated 280% between 1980-2010, while the population increased by 36.5% during the same period (US Census Bureau). Of total diabetes cases, approximately 95% are Type 2. 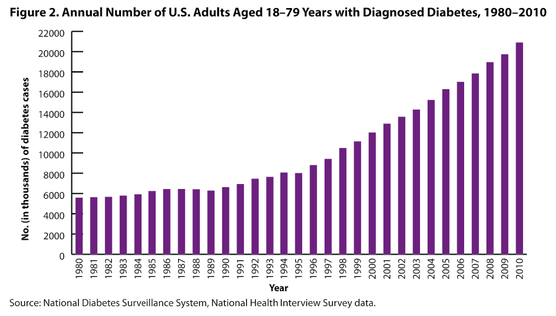 For kidney disease/end stage renal disease (ESRD), dialysis patients often require treatment around 3 times per week for prolonged periods of time. Patients, sometimes unable to drive themselves due to their post-treatment condition, often rely on public transportation or Medicaid door-to-door transportation. If they do get there by car, it is because they can afford their own vehicle or have a generous support network of family/friends. In the latter case, there are likely feelings of dependency and guilt regarding the drivers’ time, as the trips are very frequent (conflicting with the drivers' work schedules and other obligations). The charts below illustrate the rising incidence of ESRD overall and by race specifically. African Americans and American Indians are significantly more affected than others.
Our health problems related to auto-centric infrastructure do not stop at obesity-related illnesses, but they continue to health problems as a result of air pollution. The Union of Concerned Scientists (UCS) states that cars and trucks number one cause for air pollution in the US. The UCS also says that, in the US, “Particulate matter is singlehandedly responsible for up to 30,000 premature deaths each year.” They also point out that almost one half of all Americans (estimated 150 million) are living in areas which do not meet the air quality standards of the federal government. A study published in 2012 by pollution experts at the Massachusetts Institute of Technology (MIT) concluded that air pollution from roads is twice as likely to cause death when compared to traffic accidents in the United Kingdom (UK). Research by the European Commission in 2005 came to similar conclusions regarding premature deaths for all countries in the European Union. In the UK, they have considered strategic action related to building locations, in particular, separating schools and hospitals from roads. Ironically, this solution would potentially require people to drive farther if transit or active transport options (walking, cycling) are not used, contributing to additional pollution. The US Environmental Protection Agency’s (EPA) report, Our Nation’s Air: Status and Trends Through 2010, provides a few graphics (below) to illustrate the impact of air pollution in terms of number of dangerous air quality days per year and cancer risk from air toxics. Transportation is not the only contributing factor to our air quality, but it is documented as one of the most significant. 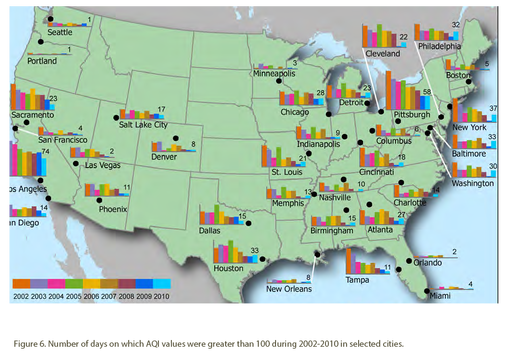 Source: US Environmental Protection Agency’s report, Our Nation’s Air: Status and Trends Through 2010 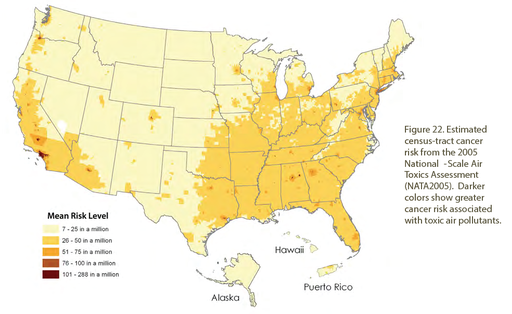 Source: US Environmental Protection Agency’s report, Our Nation’s Air: Status and Trends Through 2010 One of the most tragic ways these public health impacts are manifested is in our children’s lives. The rates of childhood obesity have skyrocketed over the years as people have become less and less likely to integrate exercise (even passively through transportation) into their daily routines. Of course, food access and other issues factor into the situation, but the built environment remains a significant contributor. 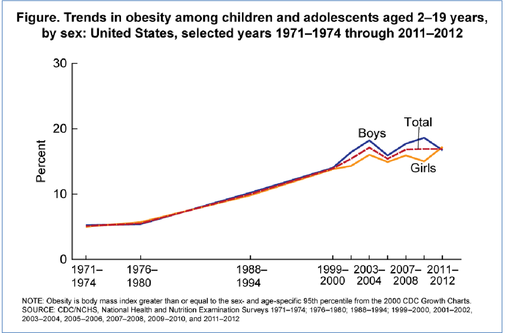 Source: Centers for Disease Control and Prevention Consequences of framing problems incorrectly The key is this - we saw transportation as a simple problem. We thought it was as simple as getting people where they needed to go, from point A to point B, as fast as possible. In fact, we were incorrect, and the decisions of previous generations have led to children of the present generation having significant health problems. We simply solved one problem (as we narrowly defined it) and created a few more in its wake as a result of limited thinking and incorrect problem framing. We suffer dire consequences; these health issues will follow our children as adults and significantly reduce their quality of life. We, at least those of us who live in a democratic society, are responsible. We are responsible for not holding our governments accountable for decisions that will greatly impact lives in current and future generations. We are responsible for not being careful with our own money, our tax money, which is pooled to make these investments. We are all held accountable for responsible decision making. The (hopefully different) future We are now living in an era in which we have the technology to avoid some unintended consequences and treat urban problems in their full complexity. We can summarize this information clearly to communicate effectively with the public. We have the open data, the big data, the crowd sourced data and the data models to structure and make sense of relationships. We have skilled experts on subject matter areas who understand interconnectivity between problems. We have people who have lived in their communities for decades and know its present and future needs. We can set up new systems for accountability, transparency, and clear communication. We only need to decide that it is a priority, create new infrastructure, and use it. "What’s worse, there is no overarching authority that is formally charged with bringing these disparate data sets together and constructing a model for identifying the true picture..." In the article, Building a Government Data Culture, Mark Headd talks about understanding the multifaceted issue of vacant properties in Philadelphia and general issues of government disconnect. It is a well-known problem that issues falling between government divisions, between government agencies, and between nonprofit and government organizations are often not dealt with effectively. Unfortunately, some of the most significant, systemic, and intractable problems fall into this area. Poverty is one such problem. For example, one aspect of poverty is having access to the right work opportunities, but it starts many years before a person seeks their first job and involves many additional factors. It straddles economic development, housing, transportation, food access, early childhood education, workforce development, and even more subject matter areas. Some US cities have no one entity that coordinates a structured response to poverty, even as our poverty levels rise to new heights. Strategic refocusing Restructuring government offices is one option, but strategically refocusing is another. Strategic refocusing entails aligning work according to problems and solutions, not according to the department/division on based labor division and professional specialty areas. The good news is that strategic refocusing, if adopted, could be a clear process with simple steps. It would mainly involve professionals changing the lens through which they look. At the heart of breaking down silos is collaborative decision-making through specific tools and processes. There is no appropriate solution without deep understanding of a problem and its root causes. First, the most challenging problems facing a given geographic area (city, county, metro area, state, etc.) would be defined to set the scope. These would not be goals, as goals are actually solutions and are often decided prematurely based on limited information. Goals arrived at too early are often an attempt to oversimplify what is not simple. As explained in the poverty example above, the most significant problems exist in-between subject specific areas. Other examples include traffic congestion, environmental degradation, and countless others. Subject matter experts, community members, and other stakeholders with a deep knowledge of local conditions would work to structure the problems, eventually creating “problem constellations” such as this one for repeated cycles of poverty. The red rectangle contains the identified problem, while the orange ellipses contain subject matter areas likely to fall within the purview of one organization or another. 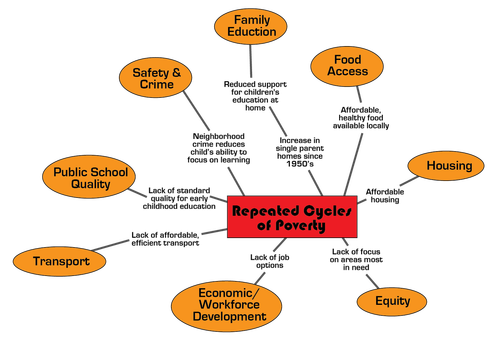 Once there is relative agreement on each problem constellation, work would begin on linking these together for a complete “problem picture.” That picture would look something like the one below. The detail of the repeated cycles of poverty problem constellation was simplified for the sake of the graphic (but the actual analysis would not be). Again, red rectangles depict identified problems, while orange ellipses depict subject matter areas. Dashed lines are used when two issues are far apart on the graphic, yet significantly related. 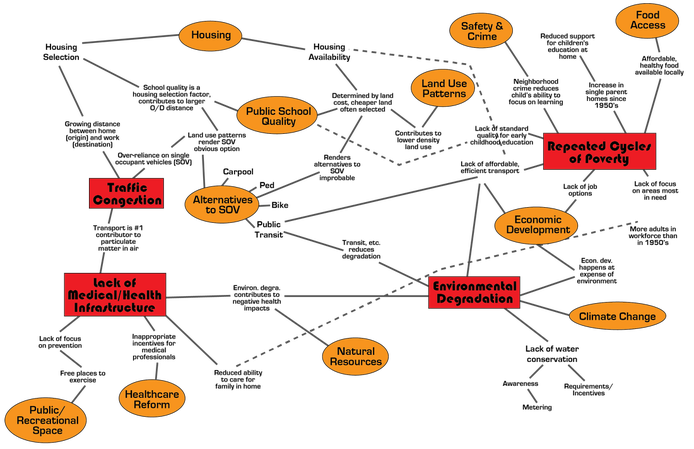 Examples have been provided for the sake of illustration; they do not represent undeniable facts. For each problem, with each group of people, outcomes would differ significantly. The process of creating this graphic is a great benefit in that it forces a discussion on what the real needs are and takes into account nuances. The graphic, as a product of the process, also provides a tool to go back and continue the discussion as situations change. The problem picture actually freezes the problems at a point in time, making something very fluid in reality static for the purpose of detailed analysis. Once the structure of the problems is set, work begins on identifying data sources and connecting the data to a model with the problem structure. Some data will be easily available, while some won't be. One additional step is to identify this missing data in order to pinpoint/create it in later phases of development. Once data are available, they are connected to model points/nodes where relevant. A lower tech method (more manual process) can be used until a higher tech one is available. For examples of data sets related to the illustrations above, feel free to contact the author (excluded due to level of detail, but open for sharing).
Pinpoint needed results, then tactics Once the problems are understood, work can begin on solutions. In some fields, this would be called options or alternatives analysis. Solutions can be understood as two-fold - tactics and results. Tactics are the programs and infrastructure put in place to alleviate problems, while results are the intended effects of the tactics. In some fields, there is no clear delineation between the two, which is a serious gap. Some professionals have become overly focused on tactics (often making assumptions about their effects/results). It is always best to focus first on the result, and allow the tactics to be the means to the end (they are rarely the end itself). Take transportation for example - the needed result, in broad sense, is connectivity between critical places for people. For this result, transportation infrastructure/services and strategic location of facilities, homes, etc. both come into play as equal tactics, since both approaches help achieve the same result of connectivity. Once a list of draft results and related tactics has been created with a group of professionals and stakeholders, testing can be begin. By systematically comparing the results against the problem areas, a group can see how well the results could help solve the problem. Once the needed results have been finalized and prioritized, the tactics get more attention. As tactics are decided to be an appropriate fit, indicators are created for how their performance (tied to results) will be measured. How will each tactic, in combination with other tactics, achieve the anticipated results? It is not important that each step is perfect or completely correct (in fact, that would be impossible), but it will become a baseline for action and sets the tone for recalibration as the data is monitored over time. In the end, the ability of the selected tactics to reach the results might not be the perfect solution, but the monitoring data will inform recalibration over time. Tactics would actually change over time as data reveals what is working toward the results most effectively. Scenario analysis, the combination of various tactic/result sets, is also an option and might make the process easier for a large group. Comprehensiveness first, then separate parts As the process moves forward, a set of measured tactics and results would have been developed with the group as a comprehensive solution to combat the problem. These tactics would then feed into individual work plans, programs, strategic plans, etc. of the various organizations. They could communicate the holistic goals or keep to their own subject matter area. Sometimes the latter is required to keep in compliance with federal regulations. It is possible to have a comprehensive and holistic approach to solving joint problems while also dividing the solutions into component parts for the sake of keeping track of subject matter area progress. This holds individual organizations accountable for their part only while working more effectively on broad societal needs. Structured public communication What may have been chaotic in the past can actually be quite systematic and structured in the future. Structured processes have the added benefit of enabling clear communication with diverse audiences. At any point, this information could be provided to the public. Of course, each audience is different, and it could be more effective illustrate a simplified or tailored version. Demonstrating progress "Each is stuck in a pattern of looking only at their own data. There are no incentives for these agencies to combine data or cross check it against the data of other departments that might have insight into the problem... Since there isn’t a clear picture of the problem of vacancy, how do we know if we’re making progress in addressing it?" Headd asks a critical, yet often unaddressed, question. We need an evidence-based 360° analytical and action framework to reduce unintended consequences and to allow for recalibrating our approach with data month-by-month and year-by-year. Do we want to look back in 50 years and see eras of misguided decisions upon other eras of misguided decisions? Being successful at handling the complexity of people requires deciding that our future will be different than our past. |
Archives
September 2015
AuthorJanae Futrell, Purpose
Structuring urban change while taking into account complexity, communication, and transparency Please Note
All views, posts, and opinions shared are my own. 
|
 RSS Feed